如何計算 CPU Cache size?
最近跟學長討論到一個經典面試題目「該如何用程式算出 CPU Cache size?」
雖然有聽過基本概念但是沒有仔細研究過,今天就來好好研究一下。
在做實驗的同時也複習不少計組的東西,自己動手做果然非常有感,推理的過程非常有意思,跟以前為了應付考試臨時抱佛腳感覺是完全不一樣的!
我不會介紹 Cache 的運作原理,因為連 Wiki 都有非常完整的介紹,我也不會解釋的比較好XD。如果對 Cache 還不熟的話,可以先參考 Jserv大師的 現代處理器設計: Cache 原理和實際影響,或是回去翻翻課本吧!
Latency Numbers Every Programmer Should Know
標題很聳動,但是其實是有道理的,如果我們不是只想寫出一些能「動」的程式,而是想要寫出能「跑」的程式,就不能不了解電腦的運作原理,其中 Cache 更是影響 Performance 的一大關鍵。這篇也只能講到冰山一角而已,待之後讀更多書了再來分享。
下圖說明,CPU的速度每年可以成長60%,相較之下RAM只能成長7%,所以其實CPU做運算的速度比從RAM讀/寫資料快的多。
圖片來源: https://www.researchgate.net/figure/Memory-Access-vs-CPU-Speed_fig1_254014003

而實際上的Latency可以參考下表,整理出以下對比 (越小越快)
- CPU : L1 Cache = 1 : 1
- L1 Cache : L2 Cache = 1 : 14
- CPU : RAM = 1 : 100
- RAM : Disk = 1 : 80000
圖表來源: Approximate timing for various operations on a typical PC
| Action | Delay |
|---|---|
| execute typical instruction | 1/1,000,000,000 sec = 1 nanosec |
| fetch from L1 cache memory | 0.5 nanosec |
| branch misprediction | 5 nanosec |
| fetch from L2 cache memory | 7 nanosec |
| Mutex lock/unlock | 25 nanosec |
| fetch from main memory | 100 nanosec |
| send 2K bytes over 1Gbps network | 20,000 nanosec |
| read 1MB sequentially from memory | 250,000 nanosec |
| fetch from new disk location (seek) | 8,000,000 nanosec |
| read 1MB sequentially from disk | 20,000,000 nanosec |
| send packet US to Europe and back | 150 milliseconds = 150,000,000 nanosec |
Latency Numbers Every Programmer Should Know 這個網站將上表以圖呈現,並有逐年比較的數字,可以考古一下電腦速度是怎麼演化的,有興趣的可以進去玩一下。
Q0: 如何得到「正確」Cache size
好啦這不能算個問題,先將我工作站電腦的規格列出來,方便後面說明。
在 Linux (Ubuntu) 可以下 getconf -a | grep CACHE 來拿到 Cache size 以及他的 N-way associative 之 N 值。
- L1D Cache line size = 64, size = 32KB, 8-way assoc
- L2 Cache line size = 64, size = 256KB, 8-way assoc
- L3 Cache line size = 64, size = 15MB, 20-way assoc
LEVEL1_ICACHE_SIZE                 32768
LEVEL1_ICACHE_ASSOC                8
LEVEL1_ICACHE_LINESIZE             64
LEVEL1_DCACHE_SIZE                 32768
LEVEL1_DCACHE_ASSOC                8
LEVEL1_DCACHE_LINESIZE             64
LEVEL2_CACHE_SIZE                  262144
LEVEL2_CACHE_ASSOC                 8
LEVEL2_CACHE_LINESIZE              64
LEVEL3_CACHE_SIZE                  15728640
LEVEL3_CACHE_ASSOC                 20
LEVEL3_CACHE_LINESIZE              64
LEVEL4_CACHE_SIZE                  0
LEVEL4_CACHE_ASSOC                 0
LEVEL4_CACHE_LINESIZE              0
Q1: 如何計算 L1 Cache Line Size
再複習一下現代處理器設計: Cache 原理和實際影響介紹的三種Cache miss。
Compulsory misses(強迫性失誤):也稱為 cold start misses,第一次存取未曾在 cache 內的 block 而發生的 cache miss ,這種 miss 是不可避免的。
Capacity misses(空間性失誤):因為在程式執行期間, cache 無法包含所有需要的 block 而產生的 cache miss。發生在一個 block 被取代後,稍後卻又需要用到。
Conflict misses(衝突性失誤):發生在 set-associative 或 direct-mapped caches ,當多個 blocks 競爭相同的 set。通常也稱作 collision misses。
我們要做的就是想辦法造成 cache miss,因為 cache miss 就會產生上面所說 fetch 的 latency,所以我們就要想辦法一直去抓一塊不存在 cache 中的記憶體,將 cache fetch 的 latency 放大。
而Cache 的最小存取單位是 cache line,所以當我讀某個位置時,實際上都會抓該位置 align 過後的大小,如果我下次讀寫的位置仍在 cache line 以內的話就不用抓新的,這時速度是非常快的。
以下 access_array()會由小到大依序傳入不同的 step,預計當 step 超過 cache 時,會導致每次都要從下一層抓一條新的 cache line。
為了避免問題太複雜,我們先不考慮 L2 Cache miss 的情況,因此我把 array size 設為 256K (小一點也可以),剛好等於我的 L2 Cache size。
#define ARRAY_SIZE (256 * 1024)
void access_array(char* arr, int steps)
{
    const int loop_cnt = 1024 * 1024 * 32; // arbitary loop count
    int idx = 0;
    for (int i = 0; i < loop_cnt; i++)
    {
        arr[idx] += 10;
        idx = (idx + steps) & (ARRAY_SIZE - 1); // if use %, the latency will be too high to see the gap
    }
}
Result
這個算是改良 Gallery of Processor Cache Effects 這篇的算法,我認為較直觀一些,至少目前沒有被我 Google 到類似的做法。程式非常簡單,但結果非常值得探討,我們可以從其中的轉折點觀察出很多細節。
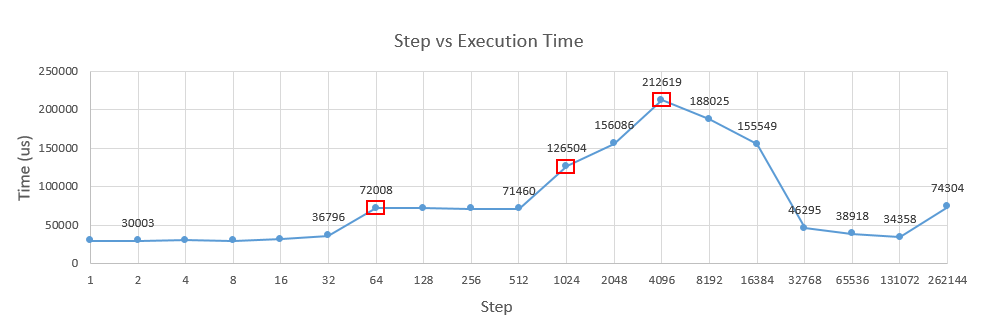
Step 1~64
在 Step = 1~32 時,執行速度非常平緩的上升,也可以說幾乎沒有改變,而在 Step = 64 時,執行時間成長了兩倍,分析如下。
Step = 1
- 每 64 次會有一次 L1 cache line miss,必須從 L2 cache fetch cache line -> 共會抓 32 M / 64 次
- 在 32K 次之後,所有的 L1 cache line 都被填滿了,從這時候開始造成 Capacity Miss。
Step = 2
- 每 32 次會有一次 L1 cache line miss,必須從 L2 cache fetch cache line -> 共會抓 32 M / 32 次
- 在 16K 次之後,所有的 L1 cache line 都被填滿了,從這時候開始造成 Capacity Miss,接下來每條 cache line 都必須從L2抓取。與 Step=1 比較,這個 miss 只是因 Step 變大而提早開始,並不會被 loop_cnt 放大,我們可以忽略,接下來就不計入討論。
Step = 64
- 每 1 次會有一次 L1 cache line miss,必須從 L2 cache fetch cache line -> 共會抓 32 M 次。
這時 Step1 與 64 的差距就出來了, loop 每一次都必須要從 L2 cache 抓新的資料,而一計算完後,馬上又再抓下一條新的,所以 cache line 就失去了加速的作用,我們可以確認 cache line size 為 64 Bytes.
Step 64~512
這個區間我卡關了很久,為什麼 64~512 的時間幾乎是差不多的?最後問到 Stackoverflow 跟 PTT 的大大們指出是因為CPU的 Prefetch 機制導致的,也就是他可以觀察你的讀寫規律,幫你偷偷去抓下一個「可能」要讀進來的位置到 Cache 中。
在 Intel 64 and IA-32 Architecture Optimization Manual有更完整的說明。我在其中 P2-30 節錄一段重點。
Data Prefetch to L1 Data Cache
Data prefetching is triggered by load operations when the following conditions are met:
- Load is from writeback memory type.
- The prefetched data is within the same 4K byte page as the load instruction that triggered it.
- No fence is in progress in the pipeline.
- Not many other load misses are in progress.
- There is not a continuous stream of stores.
Two hardware prefetchers load data to the L1 DCache:
- Data cache unit (DCU) prefetcher. This prefetcher, also known as the streaming prefetcher, is triggered by an ascending access to very recently loaded data. The processor assumes that this access is part of a streaming algorithm and automatically fetches the next line.
- Instruction pointer (IP)-based stride prefetcher. This prefetcher keeps track of individual load instructions. If a load instruction is detected to have a regular stride, then a prefetch is sent to the next address which is the sum of the current address and the stride. This prefetcher can prefetch forward or backward and can detect strides of up to 2K bytes.
重點筆記
- 只能 prefetch 在同一個實體 memory 4K page 中的位置
- 有兩種 Prefetch機制,第一種只能幫你抓下一條 Cache line,也就是 address + 64
- 第二種 Prefetch 會觀察你的讀寫規律,幫你抓你可能要讀的下一個位置,但限於 stride為前後 2K 的data,也就是 [address - 2K, address + 2K]
Step 1K & 2K
從這裡開始,前面提到的prefetcher就開始失效了,因此每次的讀寫必須真的從 L2 cache 抓取 data,導致變慢。但是照 Spec 說明應該是從 2KB 之後才開始 Prefetch不到才對,為什麼會從 1KB 就開始變慢,說實話我目前沒有找到一個完美的解釋。
Step 4K
這個最慢的Case值得我們來好好探討,這其實是有兩個因素造成的。
Collision Miss
因為我的 L1 是 8-way 32KB cache,也就是說,每個Block (64 Bytes)都對應至專屬的 Set ,每個 Set 中有8個選擇 (512 Bytes),這樣一共有 32K / 512 = 64個 Set。
所以,每 64 * 64 = 4K Bytes 的位置就會對應到同一個 Set 。翻成白話講就是 array[0], array[4096], array[8192], ... 通通都對應到 Set 0。
Array size = 256K, 我們在Step=4K時,只會存取這 Array 當中 256K / 4K = 64 個 element (Block) , 雖然 L1 cache 一共有 512 Blocks 是放的下所有 element的,但因為 Set 0 只能放 8 Block,所以就產生了 collision miss。
4K aliasing
原本以為在 4K 時最慢只是因為 Collision Miss,但我又做了一些實驗,當我把 array size 降為 16K 時,發現速度仍然是在 4K 時最慢,這時我們只會去存取 4個 element,照理來說 Set 0 是放的下的,那為什麼還會最慢呢?
Google了很久才找到答案,這與Intel CPU 針對 data hazard 設計的機制有關。
先複習一下 Data Hazard 是什麼,從下圖的例子可以看到 add r1,r2,r3 之後緊接著 sub r4,r1,r3 指令,這代表第二條 sub 指令會用前面的 r1 計算完 add 後的值,但因為 pipeline 設計,在 sub 指令進入execute階段時,這時 r1還未 writeback,所以會導致結果錯誤。
為了解決這個問題,CPU會有 Forwarding 的機制,也就是圖中看到的紅線,如果將 add 算完後的值提早在 execute階段之後就能傳入給 sub ,這樣一來就不用等到 writeback 了。
圖片來源: https://webdocs.cs.ualberta.ca/~amaral/courses/429/webslides/Topic3-Pipelining/sld033.htm

課本裡面的例子講到的都是對於 Register的 forwarding ,但實際上應用 x64 架構可以直接存取 memory,例如 add BYTE PTR [rdi+rcx], 10 ,這時必須得要算出實際上的位置 (rdi+rcx),才知道跟前面的指令是不是會有 hazard產生。
而 Intel CPU的設計剛好紀錄這個位置的 memory order buffer 只能存 address 的 LSB 12 Bits,剛好就是 4KB,所以,在存取 array[4096] 時,Intel CPU 會以為我們在存取 array[0],會試著把他forward給下一次的 add,而要直到 array[4096] 的位置被完全 decode 之後,CPU才發現原來之前的 forwarding 是錯的,得要重新 load 一次 array[4096],此時會產生 5 cycles 的 delay。
因此,在 4K 時一直不斷產生了 5 Cycles 的 delay ,但與 L2 Cache Fetch 的時間比起來還是較少的 (CPU : L2 Cache = 1:14),所以導致些微上升。
全文: 4K aliasing - what causes it in this case?
When an earlier (in program order) load issued after a later (in program order) store, a potential WAR (write-after-read) hazard exists. To detect such hazards, the memory order buffer (MOB) compares the low-order 12 bits of the load and store in every potential WAR hazard. If they match, the load is reissued, penalizing performance. However, as only 12 bits are compared, a WAR hazard may be detected falsely on loads and stores whose addresses are separated by a multiple of 4096 (2^12). This metric estimates the performance penalty of handling such falsely aliasing loads and stores.
This occurs when a load is issued after a store and their memory addresses are offset by (4K). When this is processed in the pipeline, the issue of the load will match the previous store (the full address is not used at this point), so pipeline will try to forward the results of the store and avoid doing the load (this is store forwarding). Later on when the address of the load is fully resolved, it will not match the store, and so the load will have to be re-issued from a later point in the pipe. This has a 5-cycle penalty in the normal case, but could be worse in certain situations, like with un-aligned loads that span 2 cache lines.
Step 4K~128K
從 4K 之後,我們存取的 element 越來越少,到 32K 時只存取了 256K / 32K = 8個 element,這時 Set 0 能夠全部放下,完全沒有cache miss,所以甚至比 Step = 512 還快。
Step 256K
這個 Case 變慢的原因與前面提到的 data hazard 有關,因為這時 step 與 array size 相等,所以其實我們是一直對 array[0] 做計算,而每一次的計算與前一次的結果又有關係,導致 Instruction-level parallelism 失去做用,所以時間反而比對 array 的不同 element 存取來的慢。
我把 access_array() 做一個簡單的 unroll ,也就是每次做兩次 arr[idx] += 10 並將 loop_cnt 減半,預期這個版本會跟前面的執行時間差不多,概念上的程式如下。
void access_array(char* arr, int steps)
{
    const int loop_cnt = 1024 * 1024 * 32; // arbitary loop count
    int idx = 0;
    for (int i = 0; i < loop_cnt / 2; i++)
    {
        arr[idx] += 10;
        arr[idx] += 10;
        idx = (idx + steps) & (ARRAY_SIZE - 1); // if use %, the latency will be too high to see the gap

    }
}
但很麻煩的是因為我開了 gcc -O1 優化,所以產生的組語會把這兩次加法合併,變成 add BYTE PTR [rdi+rcx], 20 ,這樣就看不出差異了,所以我直接改組語如下。
access_array(char*, int):
  mov edx, 16777216
  mov eax, 0
.L2:
  movsx rcx, eax
  add BYTE PTR [rdi+rcx], 10
  add BYTE PTR [rdi+rcx], 10 # add sequencially to make data hazard on purpose
  add eax, esi
  and eax, 262143
  sub edx, 1
  jne .L2
  rep ret
Result
- Before: 74793 us
- After: 75242 us
Q2: 如何計算 L1 Cache & L2 Cache Size
我們利用前面得出的 L1 Cache Line Size = 64 來加速洗 Cache 的速度,讓迴圈每次都存取一條 Cache Line ,一樣透過觀察執行速度的變化來估算各層的 Cache Size。
以下 access_array()則會由小到大依序傳入不同的 array size,預計當 array size 超過各層 cache size 時,會導致每次都要從下一層 memory 抓一條新的 cache line。
#define CACHE_LINE_SIZE (64)
void access_array(char* arr, unsigned size)
{
    const int loop_cnt = 64 * 1024 * 1024; // arbitary loop count
    for (int i = 0; i < loop_cnt; i++)
    {
        arr[(i * CACHE_LINE_SIZE) & (size - 1)] += 10;
    }
}
實驗結果
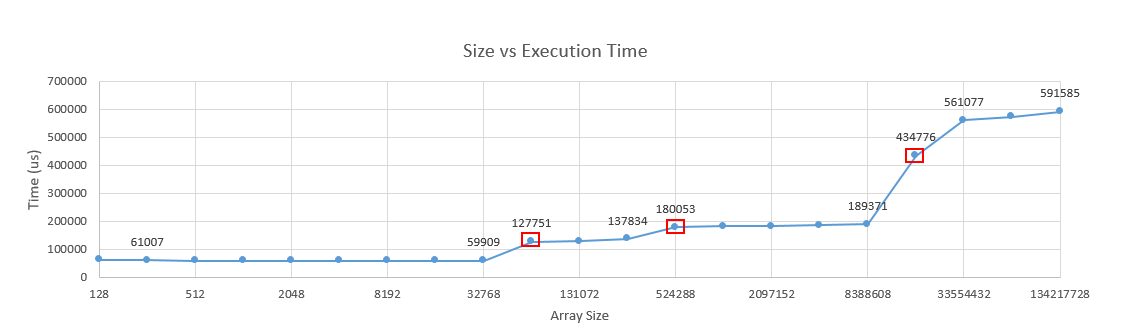
可以發現執行時間在 Size = 64K, 512K, 16M 時明顯的上升了,可以得知 L1/L2 Cache 分別是 32K 及 256K,與前面得到的值相符。而L3則是 16MB ,因為剛好我的工作站的 L3 Cache 是15MB,而且我是每次將 Array Size 加倍,如果一次增加 1MB 應該可以提前看出差距。
Size = 128 ~ 32K
- 由於小於L1 Cache Size,除了一開始的 Compulsory Miss 之外,基本上不會 miss。
Size = 64K ~ 256K
- 在 512次之後開始產生 L1 Cache Capacity Miss,這時必須從 L2 Cache 將資料抓上來。
Size = 512K ~ 8M
- 在 512次之後開始產生 L1 Cache Capacity Miss,必須從 L2 Cache 將資料抓上來
- 在 4K次之後開始產生 L2 Cache Capacity Miss,必須從 L3 Cache 將資料抓上來
Size = 16M
- 在 512次之後開始產生 L1 Cache Capacity Miss,必須從 L2 Cache 將資料抓上來
- 在 4K次之後開始產生 L2 Cache Capacity Miss,必須從 L3 Cache 將資料抓上來
- 在 245760次 (15MB) 之後開始產生 L3 Cache Capacity Miss,必須從 RAM 將資料抓上來
Reference
這幾題都是 Stackoverflow 上其他人在寫程式時真的碰到效能上的問題,原因與解法在上面的解釋非常完整,討論也非常熱烈,看完保證功力大增!
- Why does the speed of memcpy() drop dramatically every 4KB?
- Why is transposing a matrix of 512x512 much slower than transposing a matrix of 513x513?
- Why is my program slow when looping over exactly 8192 elements?
我的問題連結